Reverse High & Low
Setting this to True will cause prints at the high or low of the day to have their colors inverted. Note that the Reconstructed Tape is attached to a chart. The chart has a Session Template that defines the open and closing times of a session. The Reconstructed Tape will follow your Session Template on the chart to decide when the session opened and will set low and high of the day according to that. Note that both trades at bid and ask are reversed. There are some differences between how our software handles trades at the high/low and how Ninja does it.
NinjaTrader – assigns one color for the high and one color for the low. All prints at the low and high will be colored regardless of whether they hit the bid or the ask.
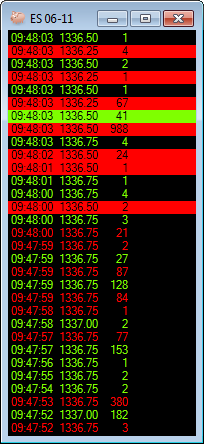
Jigsaw – reverses the colors at the high and the low. In the above example, we can see that we hit a new low of 1336.50 at 09:48:00. At this point, the inside bid was 1336.50 and the inside ask was 1336.75. At 9:48:03, the inside bid ticked down to 1336.25 and the inside ask was 1336.50. We can see a green print at 1336.50 which is still the low of the day and 1336.25 hadn’t been traded yet. This functionality is different from NinjaTrader and that difference is intentional. The occasional green prints at the low of the day highlight the fact that price has ticked down but nobody is hitting that lower bid.
Least Significant Digits
This feature allows you to truncate the most significant part of the price. This enables you to focus on the parts of the price that change. For example:
-If Least Significant Digits was set to 4 and had a price of 1348.70 on the e-mini S&P Futures, it would be displayed as 48.70.
-If Least Significant Digits was set to 3 and had a price of 1.4819 on the Eurodollar Futures, it would be displayed as 819.
This saves space but more importantly saves you from having to mentally ignore the unchanging portion and focus on what matters. It makes the tape a lot easier to read.
Note that a setting of zero will prevent any reformatting of price.
Tick Up/Down Coloring
The normal mode of operation is to color trades that hit the offer one color and trades that hit the bid a different color. With “Tick Up/Tick Down” coloring, if the price traded is higher than the previous price then it will print with the “Tick Up” colors. All prints at the same price will also be green. If a print comes in at a lower price, then this will be colored red.
High/Low from Session (NinjaTrader Only)
The daily high and low is used to reverse the colors of the prints at the high and low of the day. This setting determines if the high and low of the day comes from the session template on the chart or from the daily highs and lows from your data provider. Set to true if you want the session template to determine the highs and lows or false if you want to use the daily high/low from your data provider. Your data provider will normally be giving you the day session high and lows.
For highs and lows set based on the session templates. Consider the following session template:
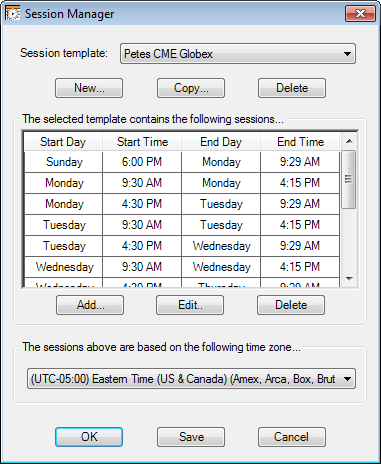
Sunday 10pm → High and low would be set to value since Sunday 6pm
Monday 8am → High and low would be set to value since Sunday 6pm
Monday 10am → High and low would be set to value since Monday 9:30am
Monday 6pm → High and low would be set to value since Monday 4:30pm
Column Spacing
The number of spaces to appear between columns
Sweep Colors
A ‘sweep’ or a ‘scoop’ occurs when a buyer buys up all the contracts offered on the inside offer. It also occurs when a seller sells all the contracts bid on the inside bid. This often ends up in moving through that price, but not always. If you set “Use Sweep Colors” to true, then these sweep trades will be highlighted.
In terms of things to look out for
-Consecutive price sweeps that do indeed move the price. For example, if someone sweeps the offer, price moves up, they sweep the next level and so on, this is strong buying pressure.
-Consecutive attempts to sweep price that do not move the price. For example, if someone hits the inside offer and price doesn’t move up, then they try again and price doesn’t move up, then someone is refreshing those offers (aka iceberg order).
-The odd sweep print here & there probably isn’t that significant. Sweep trades for 2 or 3 contracts aren’t significant. On the ES, seeing an offer of 300 get hit in one go is pretty aggressive, seeing 1000 get hit in one go is very aggressive. In those thicker markets where there is a lot of spoofing, it’s quite possible that one of these sweeps takes some contracts that were going to be pulled, leaving someone offside.
-
-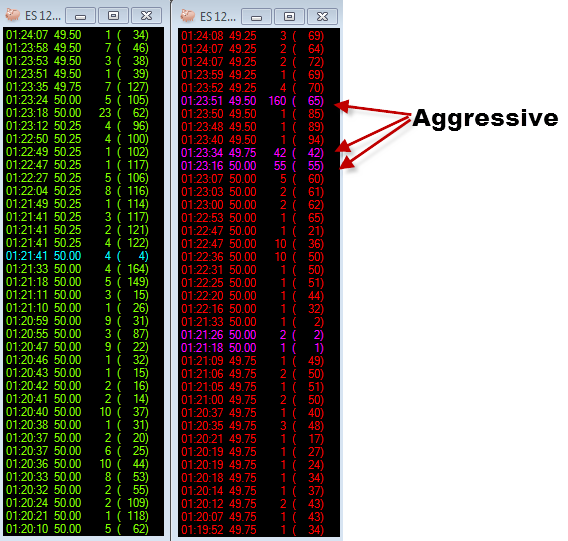
-Here we can see a single (cyan) insignificant sweep on the buy side. On the sell side we can see 50.00 got hit with 55 contracts, 49.75 got hit with 42 and 49.50 got hit with 160. This is at 1:23 AM EST, good size for the time of day.
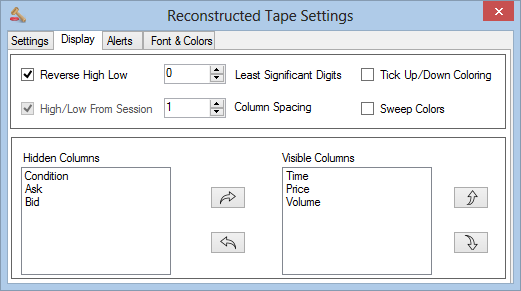
Column Positions
The lower part of the Display Tab deals with adding/removing columns. To hide a column, drag the column name from the ‘Visible Columns” section to the “Hidden Columns” section and vice-versa to make a hidden column visible. The items in the “Visible Column” section can be moved up and down to change the order in which they appear.