
“He will win who knows when to fight and when not to fight”
― Sun Tzu, Sun-Tzu: The Art of Warfare
GENERAL
JS Services Price Map analytics use quantitative methods to objectively define the price STRUCTURE of the market STATE. The knowledge of the market STATE STRUCTURE and the awareness of current price action within it, provides clarity to the value of an opportunity and the risk and reward associated with it.
The problem with technical analysis is that it is too subjective and does not provide the structure needed to quantify an opportunity. This leaves doubt and uncertainty to the value of a trade and the conviction to stick with it. It is important to understand that the PriceMap is not a series of subjective technical support and resistance levels. Subjective analysis equals an opinion which leads to interpretation and doubt about its reliability. The PriceMap IS a framework of unbiased quantitative price structure. Quantitative analytics equal facts which define “truths” and provide knowledge to what the STRUCTURE of the market STATE “is”.
The FACT based structure improves performance by presenting a framework that outlines the price alignment of the market STATE, where transitional shifts can be anticipated, liquidity is the highest, risk is the lowest and opportunity the greatest.
|
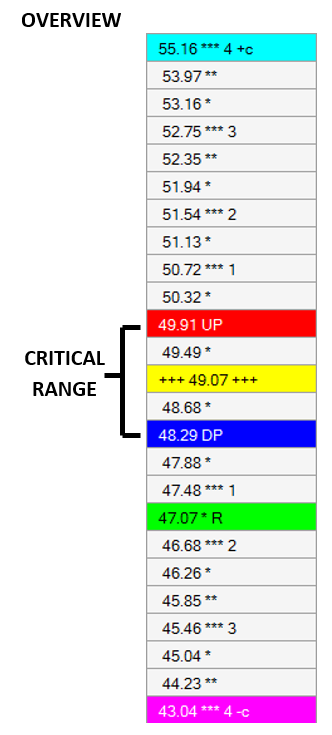
Price levels in the PriceMap series followed by stars *** are minor structure and major target "support and resistance" levels. The star *** value weights are determined by their structural significance to the market state alignment. Alignment defined as the price point that will have an influence on the market maintaining structure or not. The more stars ***, the more value a level has and the greater significance to the structural integrity of the price framework of the market STATE. Prices followed by symbols (+++ +++ (DIR), UP, DP, R, +c and – c) are directional pivots or trend indicators. These levels are the actionable points of the PriceMap, as they define where potential transitional shifts in STATE will occur and are the preferred entry levels.
In a general sense trading within the CRITICAL RANGE (UP-DP) represents a neutral posture for the market and trading outside a trend posture with the DIRECTIONAL (+++ +++) the classic pivot point within this range. The ***# levels are Upside/ Downside Target (UT/DT) projections the for a CRITICAL RANGE breakout.
The R Level qualifier represents the sentiment bias for the trade period. Trading above the R signals a positive buy break bias, while trading below signifies a negative sell rally bias. A price violation or failure at the R Level would reverse this bias.
+c and – c symbols represent Continuation Momentum numbers that define the technical event extremes.
|
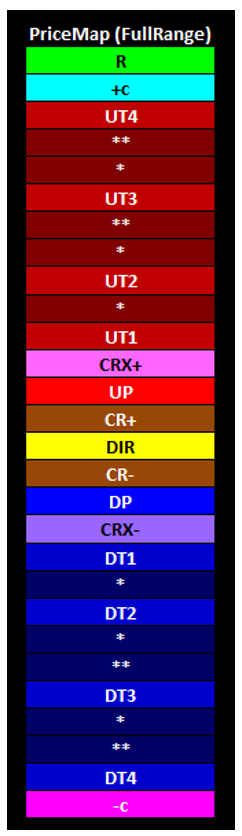
PRICEMAP QUALIFIER KEY (JSS SETTINGS)
CRITICAL RANGE
R = REVERSAL LEVEL is the SENTIMENT BIAS level for the trade period, positive bias above, negative below. UP = UPSIDE PIVOT is a key resistance point for the trade period and the top of the CRITICAL RANGE DP = DOWNSIDE PIVOT is a key support point for the trade period and the bottom of the CRITICAL RANGE
MAJOR LEVELS
DIR (+++ +++) DIRECTIONAL is a classic pivot point that sets the bias for trading within the CRITICAL RANGE (CR) UT1 (***1) UPSIDE TARGET #1 is the minimum target for a CR BREAKOUT UT2 (***2) UPSIDE TARGET #2 is the expected target for a CR BREAKOUT UT3 (***3) UPSIDE TARGET #3 is the best case objective for a CR BREAKOUT UT4 (***4) UPSIDE TARGET #4 is an event extreme target +c +CONTINUATION MOMENTUM defines the technical extreme DT1 (***1) DOWNSIDE TARGET #1 is the minimum target for a CR BREAKOUT DT2 (***2) DOWNSIDE TARGET #2 is the expected target for a CR BREAKOUT DT3 (***3) DOWNSIDE TARGET #3 is the best case objective for a CR BREAKOUT DT4 (***4) DOWNSIDE TARGET #4 is an event extreme target -c -CONTINUATION MOMENTUM defines the technical extreme
MINOR LEVELS
* MINOR 1 STAR LEVEL represent a minor support or resistance level ** MINOR 2 STAR LEVEL represent a good minor support or resistance level CRX+ CRITICAL RANGE EXTREME + defines the CRITICAL RANGE + EXTREME CR+ CRITICAL RANGE + defines the interior +quadrant of the CRITICAL RANGE CR- CRITICAL RANGE - defines the interior -quadrant of the CRITICAL RANGE CRX- CRITICAL RANGE EXTREME - defines the CRITICAL RANGE - EXTREME
MARKET METRICS
VAR = VARIANCE - defines the optimal area influence of a Major or Minor Level AD = ALERT DISTANCE - defines the area of signal acceptance and structure thresholds for a Major Level MSD = MAXIMUM STOP DISTANCE - Defines the maximum area of influence of a Major Level
|
|
STRUCTURE OVERVIEW
In a general sense the PriceMap views the market as a staircase or ladder. As the market moves from step to step, what once was support becomes resistance. As each level is successfully breached, further gains or losses are expected to the next level on the PriceMap in the direction of the violation. An un-sustained violation of a PriceMap level however is a sign of exhaustion, signaling a price move back to the previous level.
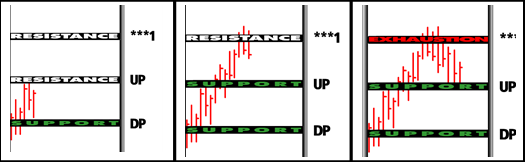
In its most basic form price action will move through the market STRUCTURE "ladder" from one level to the next. The PriceMap defines the segment moves the market is trading in and the price action within this structure provides opportunities from the reactions they provide.
CLARITY is found by observing PRICE ACTION within MARKET STRUCTURE in the CONTEXT of the MARKET STATE.
QUICK START
The PriceMap provides traders with the ability to anticipate opportunity at key structure points and create risk defined strategies with improved trade vision of expected price movement. The method is scalable as a unified approach across all markets and asset classes.
PRACTICAL APPLICATION
* Focus trading and signal acceptance at PriceMap level structure points. Avoid trading "in the middle".
* Value trade opportunities and position sizing based on the PriceMap qualifier weighting. As a rule of thumb the R LEVEL should carry the greatest value or position size followed by the CRITICAL RANGE extremes (UP and DP). The DIR “Directional” (+++ +++) and *** 3 star PriceMap level target next followed by the ** 2 and * 1 star PriceMap levels. The +c and -c are major "target" levels but should be integrated as a directional pivot for insight to market momentum in the next session.
* Use the PriceMap as a "ladder" for trade management. Think in terms of price segment trade vision with opportunities defined as 1/2, full and X2 APMD (Average Price Map Distance) profit targets.
* Use the PriceMap as a "ladder" for position management. Markets make trend moves by holding positive or negative structure. Use price action within the PriceMap as a position management tool, adjusting stops as the market breaches a PriceMap level anticipating that it will go to the next level by holding above/below the breached level. If the breached level cannot sustained the violation it is a "tell" that the market may be set to REVERSE for a test of the opposing level on the PriceMap.
MARKET STATE AWARENESS
The EDGE in discretionary trading comes in your ability to make intuitive decisions. It is the fluid execution of a trade plan with no hesitation or 2nd thought. The ability to trade “in the zone” comes from awareness of the current market STATE condition and getting “in sync” with its attributes and nuances. Understanding and knowing these facts improve awareness and provides “real time” CLARITY. It is in these moments of CLARITY that the decision process shifts from “reacting” to events to anticipating them. As a trader you are no longer “trying” and thinking about what to do but rather you know what to do and are doing it.
The process of monitoring price action within market STRUCTURE in the context of the market STATE and aligning tactics with the dominant STRATEGY theme improves consistency and supports a sustainable trade plan.