The JSS Tab defines the options for JS Services Integration. For more information on JS Services Integration click here
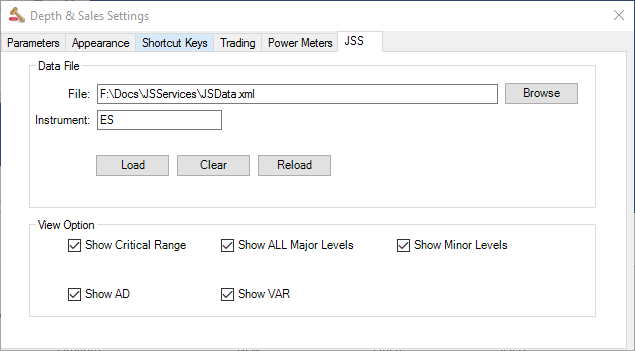
•Data File - The location of the data file produced by the JS Desktop Tool. By Default this is the (My) Documents\JSServices\JSData.xml
•Instrument - The Instrument ID in the JS Services Application (defaults to the first 2 characters of the platform instrument id). Be sure that the Instrument symbol matches the JS Symbol from the JSDesktop Market Grid. If it does not, then change the Instrument to the JS Symbol. For example IF ZN is entered in the Instrument box for the 10yr T-NOTE futures THEN change it to the JS Symbol TY to view the Price Map levels.
•Load - Click the LOAD button to update the levels each day. The data is loaded from the JSDesktop which will automatically update if left open. Note the Desktop date to confirm it is current. If not then refresh the JS Desktop so it has the correct Date and then click LOAD in the JSS integration setting to update JIGSAW.
•View Options - Allow you to customize the JSServices PriceMap levels to be displayed. For a an overview of JS Services PriceMap levels click here
oShow Critical Range - Check if you want to display Critical Range
oShow All Major Levels - Check if you want to display all Major PriceMap Levels
oShow All Minor Levels - Check if you want to display all Minor PriceMap Levelso
oShow VAR - Check if you want to display Variance around the level
oShow AD - Check if you want to display the Alert Distance around the level
oShow MSD - Check if you want to display the Maximum Stop Distance level
For more information on JS Services Integration click here