Description of Application Terms
JS Services Analytics incorporates both technical and behavioral variables that have been developed from observations over the past 30 years, into a quantitative model, to numerically define a markets technical STATE. The analytics, more than anything else, are an awareness tool to what the current conditions are, so trading methods can be optimized by aligning tactics with these facts. When the micro dynamics of the order-book are viewed through the macro structure of the STATE, there is real clarity and the ability to trade more intuitively is improved. The JSServices integration with JIGSAW Trading provides this utility which is the basis for a sustainable trade plan.
![]() DESKTOP
DESKTOP
JIGSAW Integration
Overview – The following is a primer that goes over the Macro Market State condition, its price STRUCTURE and inherent STRATEGY themes that are part of the JSDesktop.
![]() DESKTOP
DESKTOP
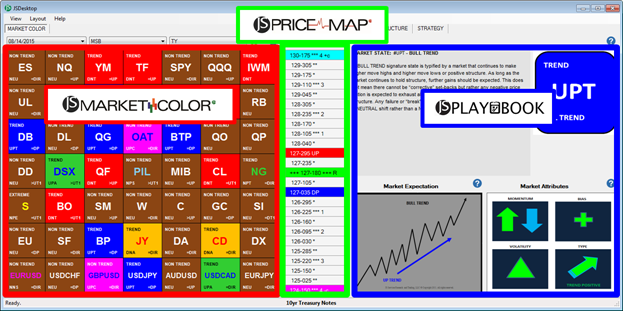
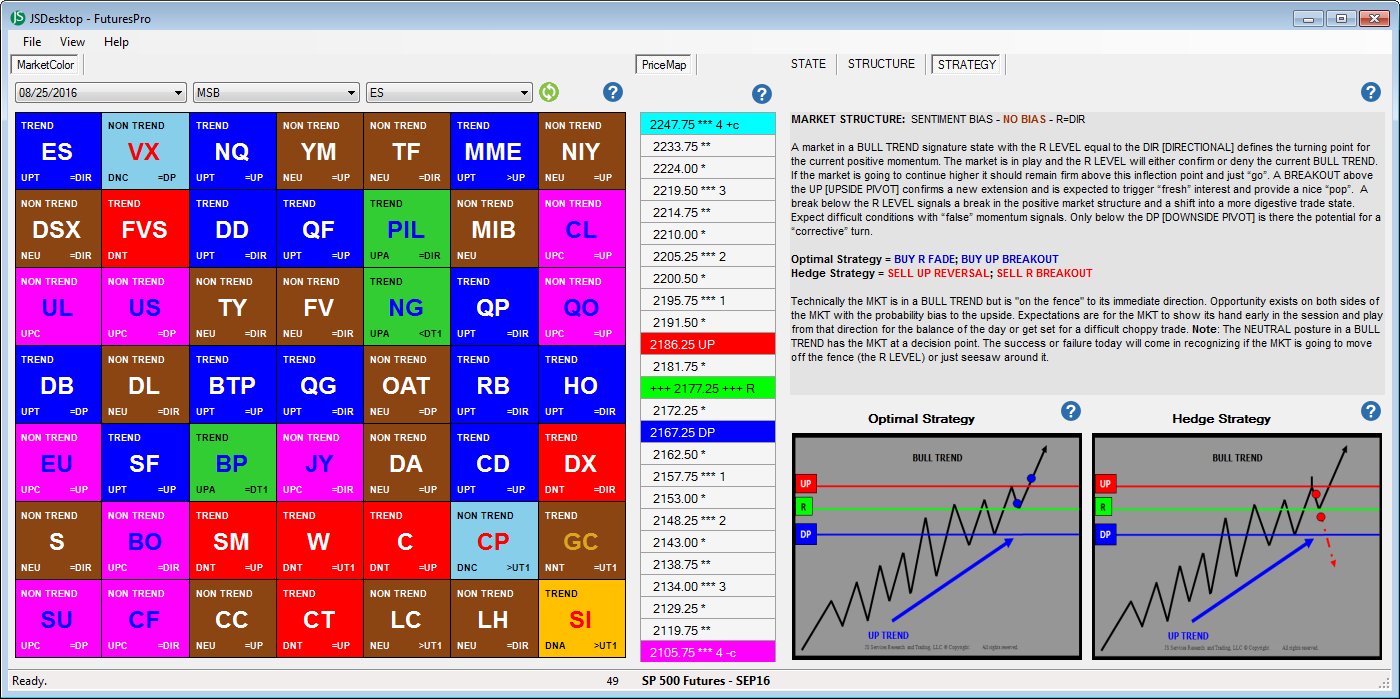
The JSDesktop is divided into 3 sections; MarketColor “STATE” Grid, PriceMap STRUCTURE and STRATEGY PLAYBOOK.
![]()
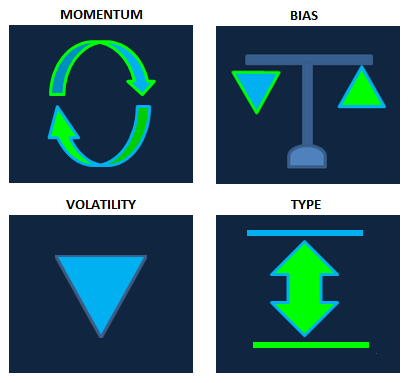
MarketColor defines the current market STATE and its unique attributes. These attributes provide insight to how price action will be influenced by various market factors so tactics can be aligned to optimize performance.
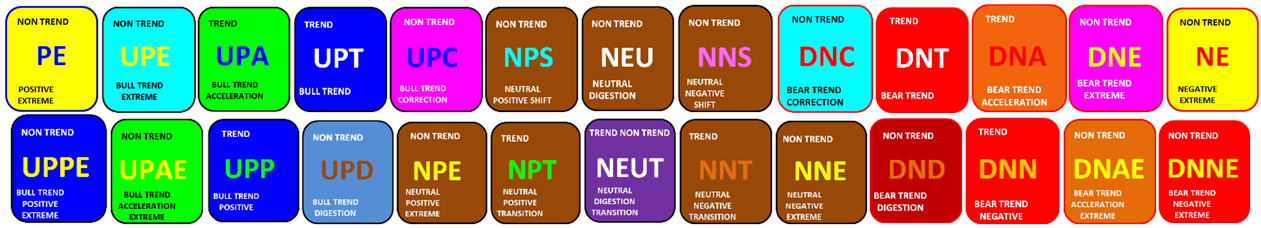
The market STATE is the unique character of the technical condition. Most traders define market STATE as either “trending” or “non-trending”, a black and white definition. MarketColor provides a more granular HD picture of what the current trading conditions is, revealing the nuances of the technical foundation of the market. JS Services has identified 26 signature STATE conditions, each with its own unique characteristics and attributes. The result is an objective fact, defining what “is” the current STATE, improving awareness and identifying opportunity "at a glance".
STATE
Markets are fundamentally driven and interconnected. Price movement within the fundamental foundation creates a technical Market STATE. Each Market STATE has its own “color” or characteristics and attributes that define it.
CONDITION CHARACTERISTICS ATTRIBUTES

If trading is a chess game then all the methods and tactics used to make trading decisions are the pieces that the game is played with. The market STATE condition is the board the game is played on. Tactics are optimized when they are aligned with the context of the STATE which represents the foundation condition of any strategy.
STRUCTURE
As fundamentals change, shifts in the Market STATE occur. These shifts originate at Market STRUCTURE, which are the price levels that define the STATE alignment.
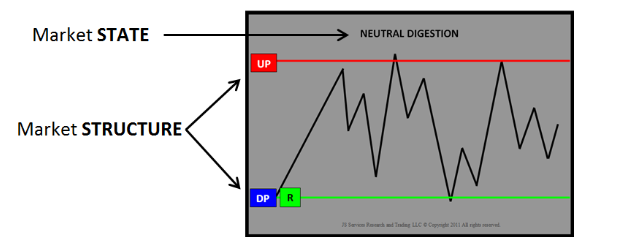


JS Services Price Map analytics define the price STRUCTURE of the market STATE. The knowledge of the market STATE STRUCTURE and the awareness of current price action within it, provides clarity to the value of an opportunity and the risk and reward associated with it. More
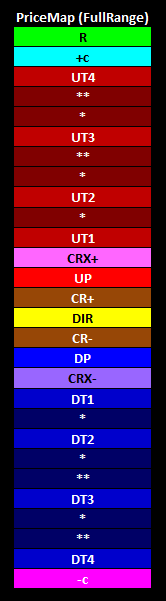
PRICEMAP
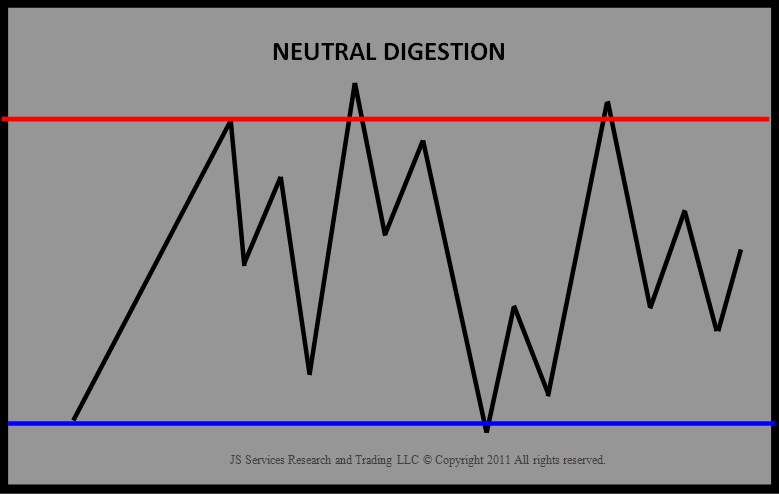
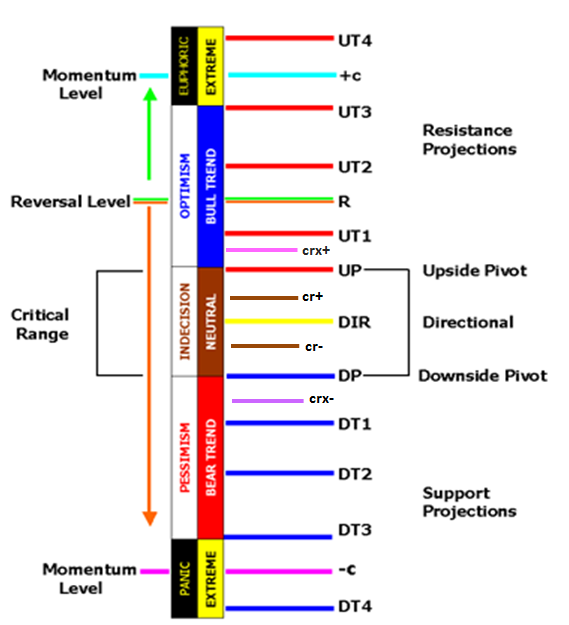
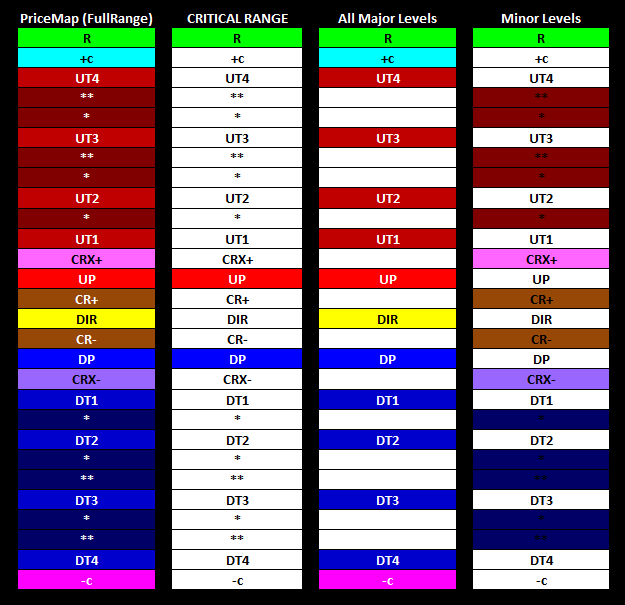
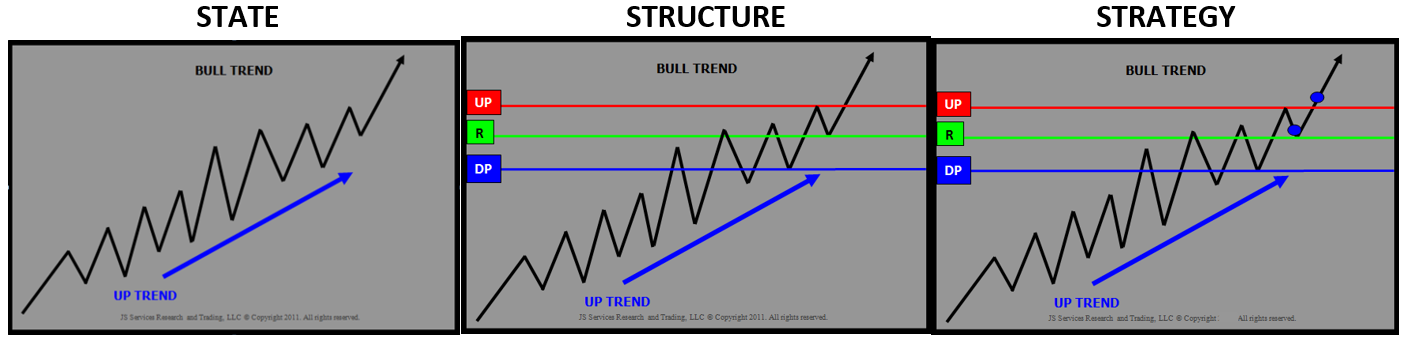
In a general sense, price action is in a constant state of expansion (trending) and contraction (non-trending). The aspects of the different types of trending and non-trending movement can be classified into unique conditions or market STATEs. Transitions in STATE occur when the expansion or contraction reach a zenith in the varying degrees of the ebb and flow. It is at this moment before the market continues to expand or contract (transition or not transition and hold structure), that it is considered to be at a point of dynamic equilibrium. It is these points of equilibrium that define the STRUCTURE of the market STATE. The JS Services PriceMap identifies these points of equilibrium using 3 price points. A CRITICAL RANGE price band and a sentiment bias REVERSAL level (R LEVEL).
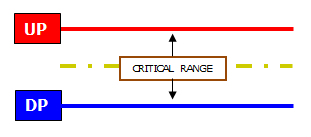
CRITICAL RANGE is defined by the UP [UPSIDE PIVOT] and DP [DOWNSIDE PIVOT] representing the upper and lower extremes of the band. The Critical Range provides hard STRUCTURE, outlining the price alignment that defines each unique STATE.
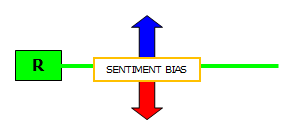
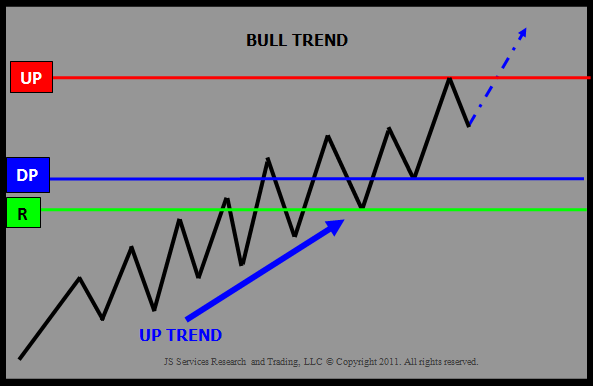
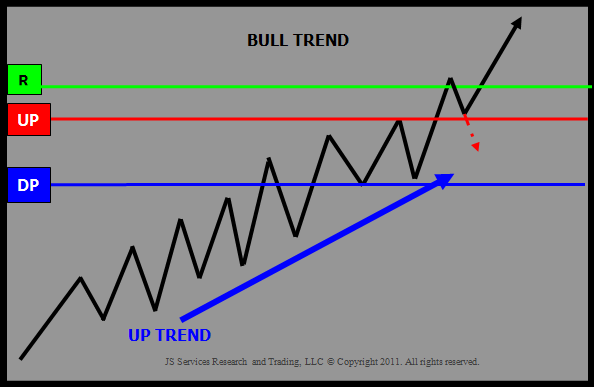
R (REVERSAL) LEVEL or SENTIMENT BIAS identifies the inflection point where the bias for the trade period shifts from positive to negative. It is the technical “over under” level that will skew the character of the STATE. An R LEVEL below the market in a BULL TREND state is in alignment, as both indicate a positive buy break bias. The sentiment skew is in conflict however when the R LEVEL is above the market in a BULL TREND state. In this condition it has a negative bias below the R LEVEL or a “corrective” expectation.
Positive Sentiment Negative Sentiment
The PriceMap provides the macro structure of the market STATE condition. It is at these equilibrium points of alignment that large fund traders participate and provide liquidity. The "middle" area between PriceMap levels is where the predatory Algos reign and have more sway. Focusing signal acceptance at the PriceMap structure points is the 1st step in optimizing performance.
METRICS
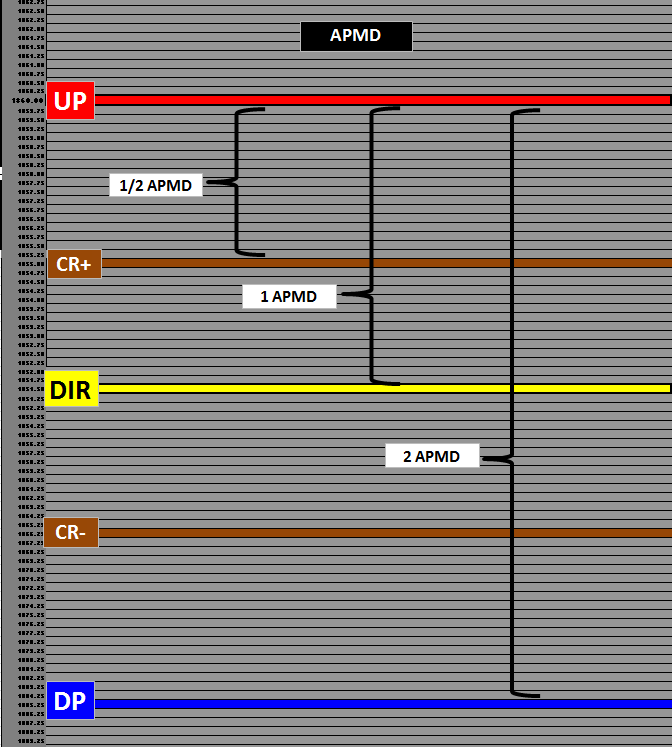
A component of the PriceMap structure is that it identifies the price segment distance the market is currently trading in. This metric is referred to as the Average Price Map Distance or APMD and can be used to determine the risk / reward viability of an opportunity. The study is a static overlay that provides a unified approach for strategy construction and position management across all markets.
APMD (Average Price Map Distance) defines the distance between 2 Major PriceMap levels. Markets typically move in ½, x1 and x2 APMD impulses, the framework of which is outlined in the full PriceMap STRUCTURE. More
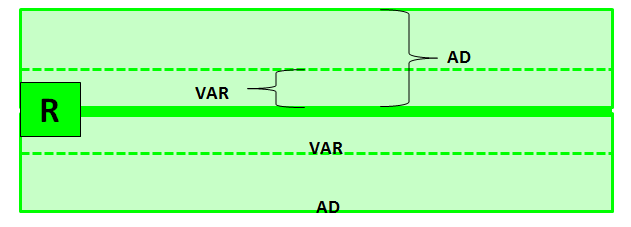
The price zone surrounding a Major PriceMap level has 3 key Metrics associated with it.
VAR (Variance) defines the optimal ENTRY area for an opportunity.
AD (Alert Distance) defines the area of signal acceptance and market STRUCTURE thresholds.
MSD (Maximum Stop Distance) - Defines the maximum area of influence of a Major level.
MARKET STATE TRANSITION
A market STATE condition as a definition does not change and is the same from day to day or from market to market regardless of asset class. A BULL TREND STATE will always be classified as a trending market that has positive higher move high higher move low structure. That is the definition of what a BULL TREND “is”. If the market is not maintaining positive structure then the definition is no longer true and signals that the market is transitioning into a different STATE. In a general sense markets that are performing to their STATE expectation are easier to anticipate verses markets that are not performing to expectation and are transitioning into a new market STATE.
We do not know when a market will transition to a new market STATE but we do know where it will make a decision to do so or not. It is at the market STRUCTURE points that define the price alignment the STATE that the market will make a decision for the current STATE to persist by holding structure or break structure and transition to a new MARKET STATE.
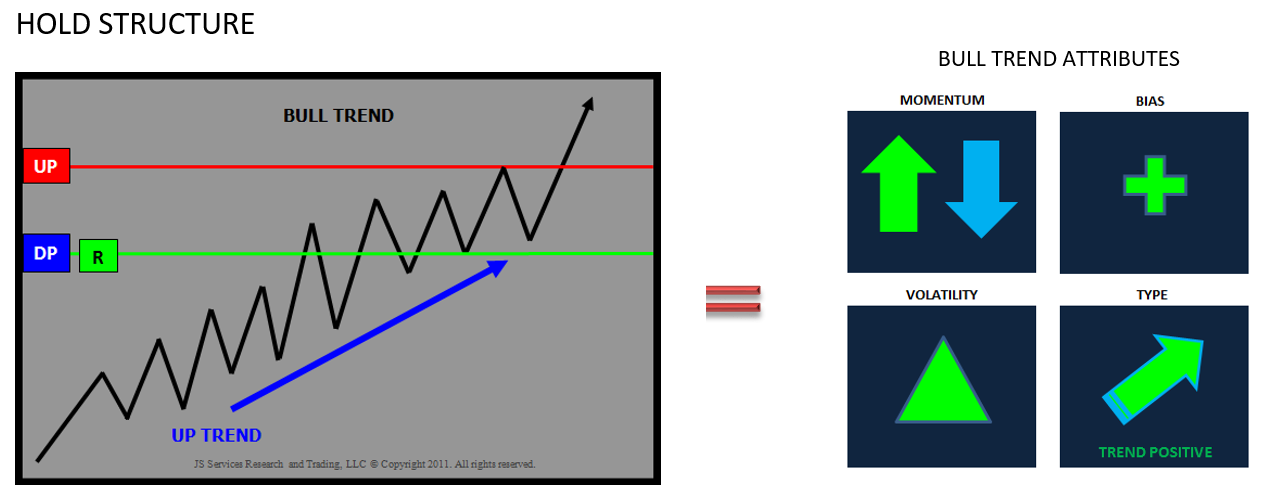
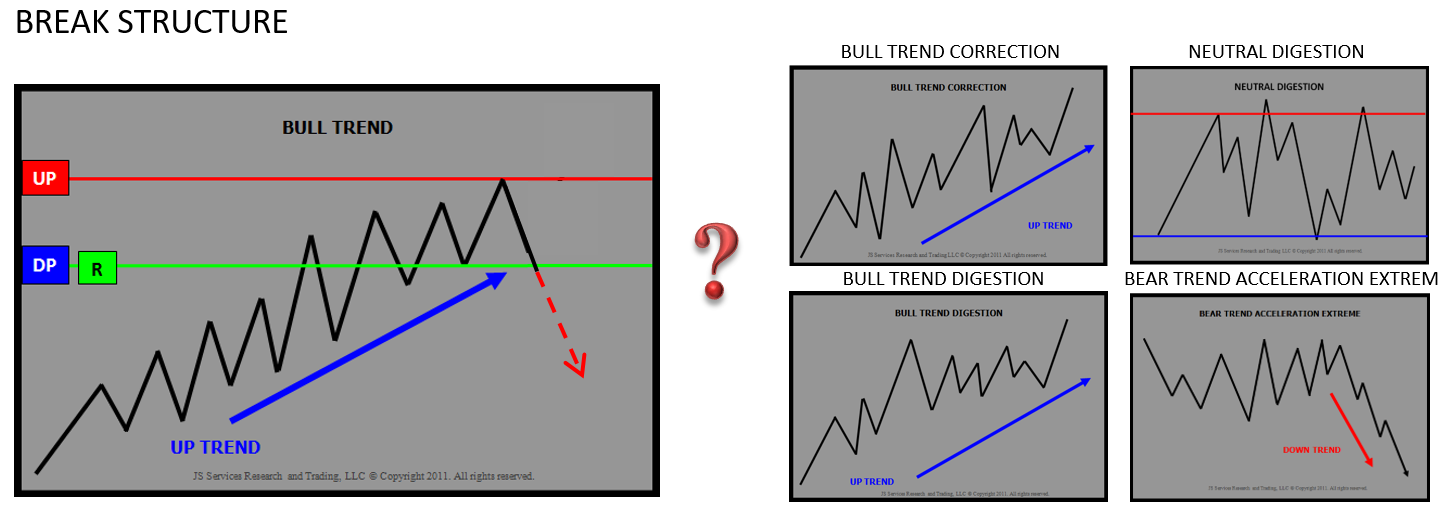
If price action holds STRUCTURE, it is a sign that the attributes of the market STATE will dominate price action. A break in STRUCTURE is a signal that the market is in transition to a new STATE. Markets that hold STRUCTURE are easier to predict as the context of the trading condition is known. Markets in transition that break STRUCTURE are more difficult to predict as the characteristics of the condition are fluid and not defined.

The PLAYBOOK offers a clear trading STRATEGY by providing a comprehensive overview of a market’s technical STATE, its STRUCTURE and inherent STRATEGY themes. It is a foundation trading resource that can be applied independently or as a technical overlay for a discretionary or systematic trading approach. This knowledge provides a more informed strategy foundation to make intuitive decisions and align trading tactics.
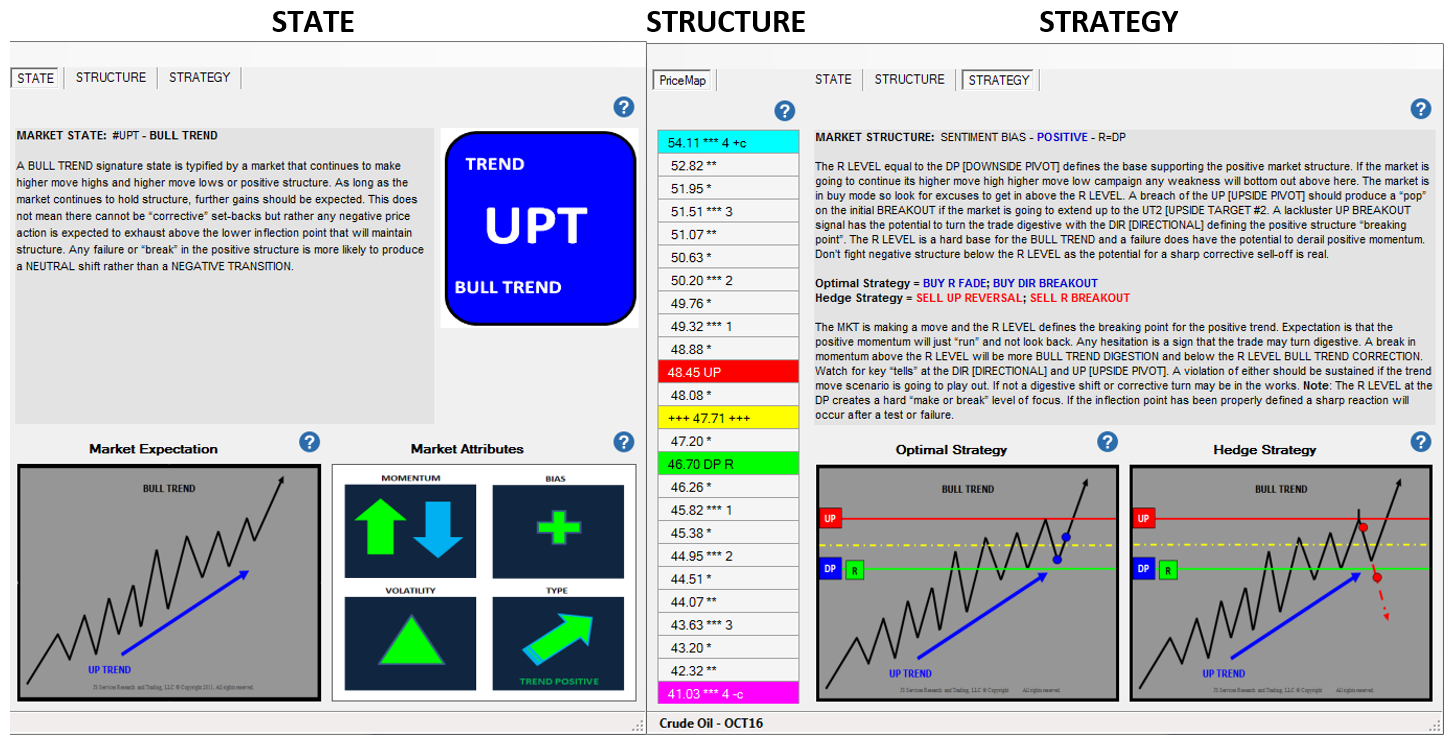
JS Services has identified 26 unique market STATE “environments” each with 9 different behavioral skews, resulting in 234 unique themes or “plays”. The PLAYBOOK is a virtual "IF \ THEN" scenario script. IF the market is in this STATE and has this STRUCTURE THEN these are the inherent Optimal and Hedge STRATEGY themes. The PLAYBOOK "Play" definitions are static and do not change as they are based on facts. Any market in the same STATE with identical STRUCTURE will be in the same “play” position and will demonstrate the same characteristics and have the same expectations no matter what asset class. It is this technical MARKET STRUCTURE BIAS [MSB] that lays the foundation for quantifiable market STRATEGY PLAYBOOK.
STRATEGY
The IF THEN dynamic of holding STRUCTURE or breaking STRUCTURE, within the context of a unique market STATE condition, can be categorized into specific STRATEGY themes.
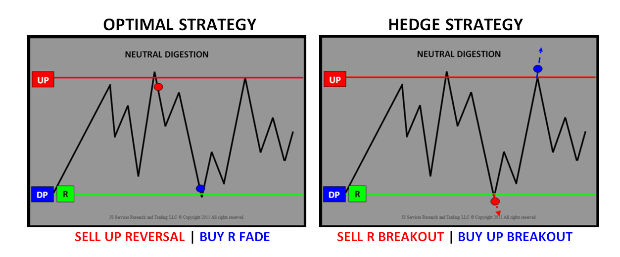
It is these inherent Strategies that represent the best risk defined opportunities for the trade period which can be used as a stand along strategy or a theme to align trading systems and tactics to.
The STRATEGIES are defined using 3 basic ENTRY techniques; FADE momentum, trade with momentum BREAKOUT and exhaustive REVERSAL.
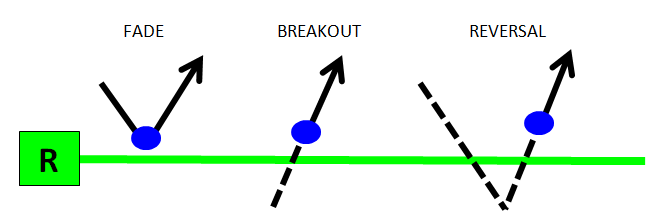
The naming schema, BUY R FADE strategy reads as follows; looks to BUY the market at the R LEVEL using a FADE entry technique. This is a “theme” so the essence of the strategy is to FADE momentum into the R LEVEL area. Trading tactics and methods should be aligned with the basic properties of a FADE.
MICRO STRUCTURE
The PLAYBOOK defines the macro strategy foundation for a specific opportunity at a qualified PriceMap level. It is important to understand the micro structure surrounding each level to optimize trading tactics.
The VAR (Variance) represents the OPTIMAL ENTRY area for an opportunity. The AD (Alert Distance) represents the area that is valid for Signal Acceptance for ENTRY ( ). In addition this area also acts as a Signal Alert Distance ( ) which can be used as a threshold to confirm a level violation as well as for position management and stop placement. The example below shows the FADE, BREAKOUT and REVERSAL strategies incorporating the Market Metrics as an Alert and as areas for signal acceptance.
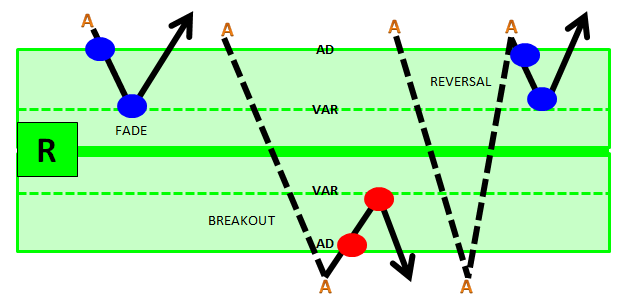
The example above shows the FADE, BREAKOUT and REVERSAL strategies incorporating the Market Metrics as an Alert and as areas for signal acceptance. The metrics can be used for Stop placement and position management as well.
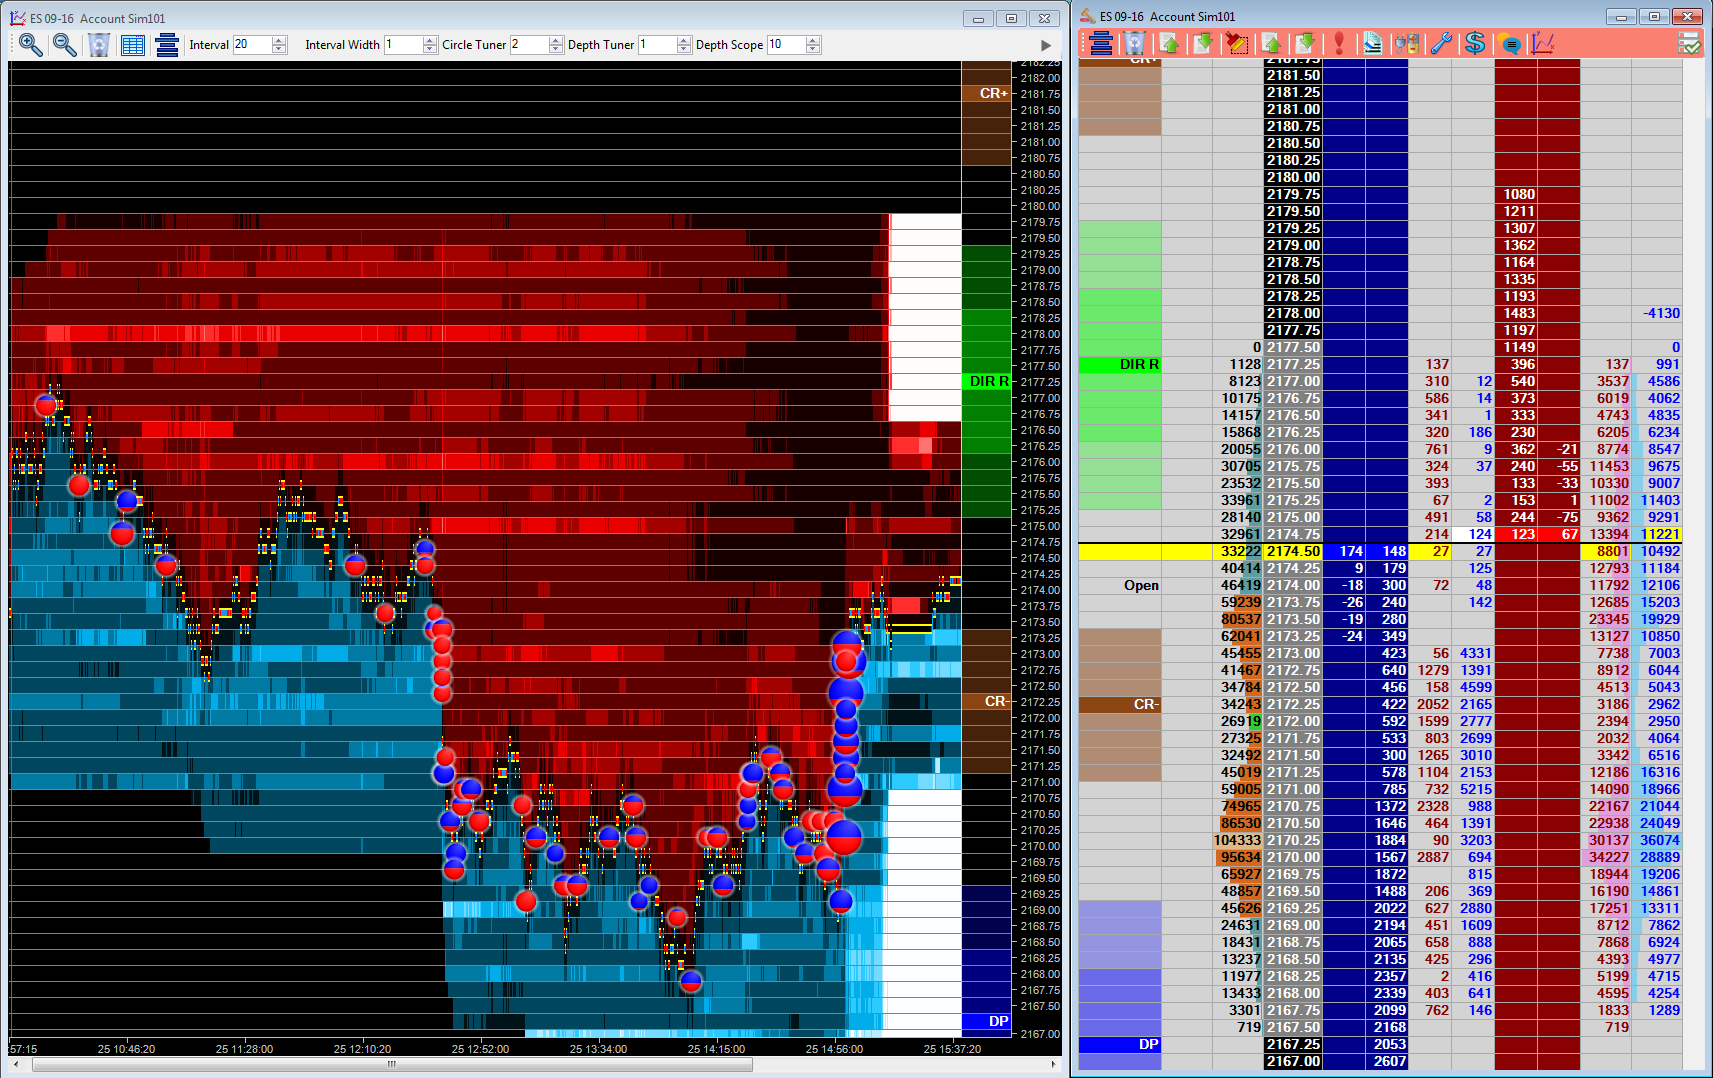
MICRO ORDER-BOOK DYNAMICS
The process of monitoring price action within market STRUCTURE in the context of the market STATE and aligning tactics with the dominant STRATEGY theme improves consistency and supports a sustainable trade plan by improving awareness to the macro condition. The execution of a trade plan must account for the micro dynamics of the order-book by monitoring order flow to improve timing and confirm liquidity alignment within the PriceMap market Metrics. More
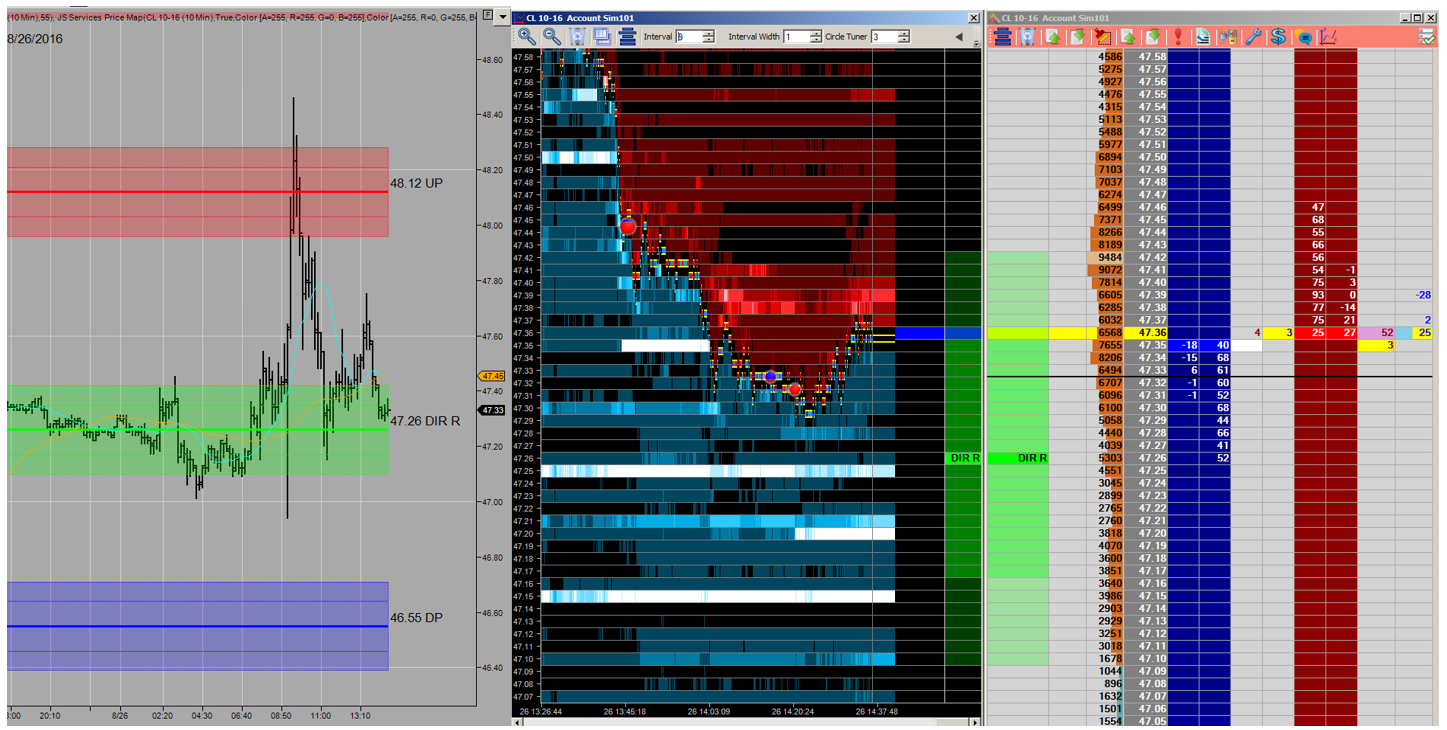
CLARITY is found by observing PRICE ACTION within MARKET STRUCTURE in the CONTEXT of the STATE.
MARKET STATE AWARENESS
The EDGE in discretionary trading comes in your ability to make intuitive decisions. It is the fluid execution of a trade plan with no hesitation or 2nd thought. The ability to trade “in the zone” comes from awareness of the current market STATE condition and getting “in sync” with its attributes and nuances. Understanding and knowing these facts improve awareness and provides “real time” CLARITY. It is in these moments of CLARITY that the decision process shifts from “reacting” to events to anticipating them. As a trader you are no longer “trying” and thinking about what to do but rather you know what to do and are doing it.
JSServices Jigsaw Trading integration supports this intuitive function by providing awareness of the macro and micro STATE condition as a FACT based foundation for a sustainable trade plan.